What Is a Digital Shelf Audit?
What a digital shelf audit covers, the questions it should answer, the KPIs worth scoring, and the data on what image and content fixes are actually worth in sales.

We crawl every main retailer in every market our customers sell in, overnight, at Eebz, so I look at a lot of product pages. Most of them are quietly losing money, and the brands behind them usually don't know where.
A digital shelf audit is how you find out. This article covers the digital shelf - how your products appear, perform and compete across online retailers, marketplaces, search engines, delivery apps and, increasingly, AI shopping experiences. If you came here looking for physical shelf audits, store-level availability and pricing bridge both worlds, and we cover those too. But the focus here is the online shelf: are your products available, easy to find, accurately presented, competitively priced, and actually converting shoppers?
That sounds obvious. The difference is that a physical store has one shelf, and your digital shelf is every product page on every retailer in every market you sell in. Nobody can walk that aisle by hand, which is why most brands audit a sample once a quarter and hope. More on that later.
What a digital shelf audit covers
A proper audit examines every dimension that affects whether a shopper can find, trust and buy your product.
| Area | What to examine |
|---|---|
| Availability | In-stock rate, out-of-stock frequency and duration, geographic coverage, delivery eligibility |
| Assortment | Listed vs authorised SKUs, missing products or variants, launch coverage, discontinued items still live |
| Discoverability | Search rank on priority keywords, category placement, share of first-page results, organic vs sponsored visibility |
| Content quality | Accurate titles, descriptions, specifications, dimensions, claims, usage instructions and FAQs |
| Images and media | Image count and resolution, correct pack shots, mobile readability, video and rich content |
| Pricing and promotions | Current and list price, price index against competitors, unauthorised discounting, promotion visibility and accuracy |
| Ratings and reviews | Average rating, review count and recency, recurring complaints, sentiment trends |
| Buy Box and sellers | Buy Box ownership, authorised vs grey-market sellers, seller ratings |
| Fulfilment | Delivery speed and cost, pickup options, promised vs actual delivery |
| Brand consistency | Correct naming, claims, packaging and tone across every retailer |
| Competitive position | Competitor search rank, price, content quality, ratings and share of shelf |
| Compliance and technical accuracy | Required disclosures, retailer content rules, duplicate listings, broken pages, mismatched GTINs and variation errors |
Fifteen categories would be more thorough. Twelve is what teams actually finish.
The five questions an audit should answer
Strip the framework back and a useful audit answers five questions.
- Can shoppers buy the product? Availability, assortment, delivery and Buy Box status.
- Can shoppers find it? Keyword rank, category visibility and share of search.
- Does the listing persuade them? Content completeness, imagery, reviews and conversion elements.
- Is the offer competitive? Price, promotions, ratings, delivery and seller quality.
- Is execution consistent? Whether every retailer shows approved, current information.
If your audit report can't answer all five for a given SKU at a given retailer, it isn't finished.
What the fixes are worth
Auditing is pointless unless fixing what you find moves sales. The published evidence is patchier than vendors like to pretend, but the credible sources all point the same way.
Start with Amazon's own numbers. Its guidance for brand owners, based on internal data, puts the lift from basic A+ content at up to 8%, and from well-implemented Premium A+ content at up to 20%. Amazon is careful to call these averages rather than guarantees, and so am I, but nobody measures more product pages than the platform they sit on.
Rich content holds up off Amazon too. Salsify, which syndicates content for thousands of brands, reports that product pages carrying enhanced content convert 15% higher, from its 2023 internal data. Its shopper surveys explain why: 61% of shoppers rank images and video as the most important element of a product page, and one in three has abandoned a purchase because images were poor or missing.
Image quality has academic backing as well. Cornell Tech researchers analysed listings on eBay and Letgo and found that better photographs alone made shoes 1.17 times more likely to sell and handbags 1.25 times more likely. Same product, same price. The photo did the work.
The waste is the frustrating part. Retail audits by ChannelSight found most live product images are too small to zoom and only 40% of products carry more than two images, while over 90% of the missing assets already exist in the brand's own systems. The photography has been paid for. It just never made it to the shelf.
On word count the honest answer is that the evidence is thin. I have not found a credible study showing that longer descriptions, by themselves, sell more. Analyses of large page samples suggest a sensible range by category, roughly 150 to 300 words for fashion and up to 600 for furniture, with electronics in between, but the consistent finding is that completeness beats length. A description that answers the shopper's actual questions outsells a longer one that doesn't, and past that point extra words just push the specifications further down the page. The section below shows the same thing in our own data.
What the top of the category actually carries
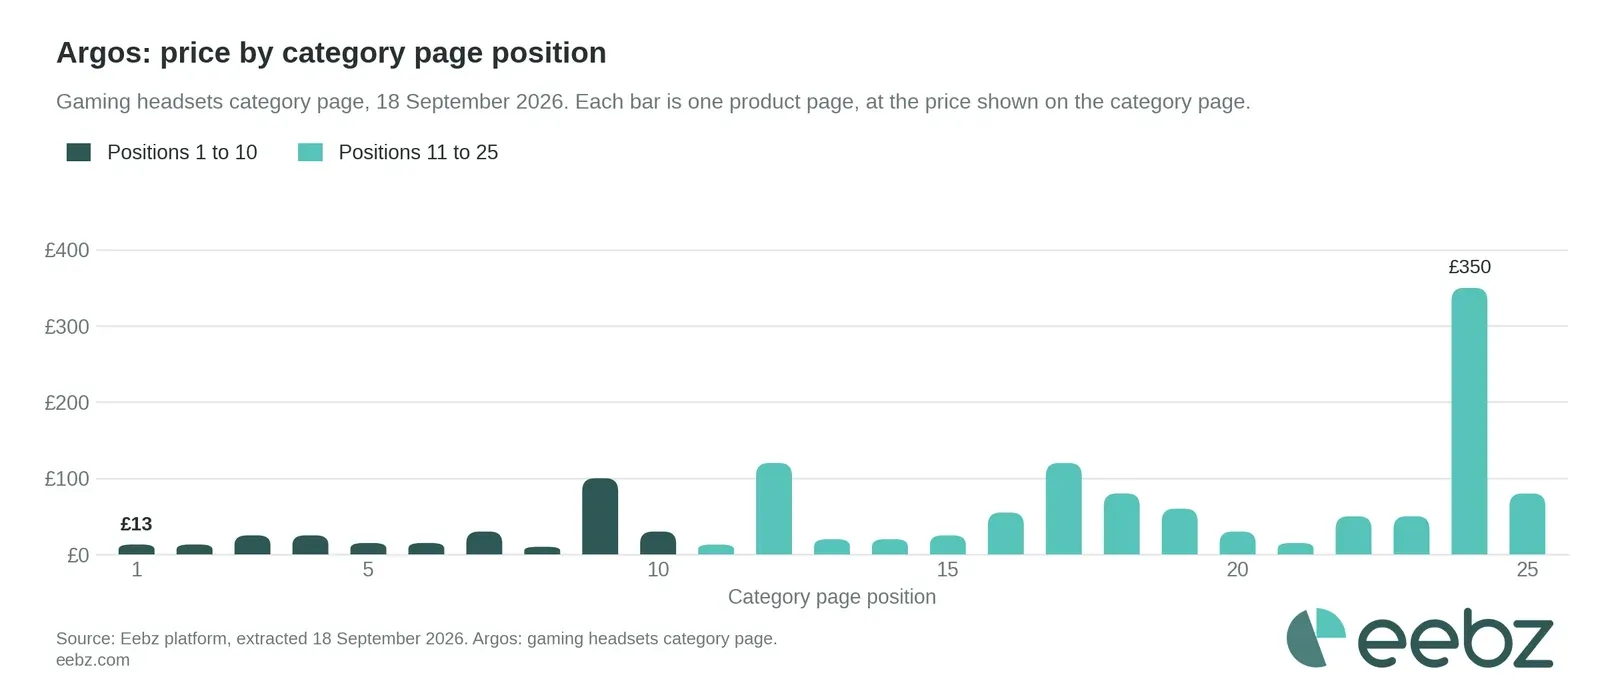
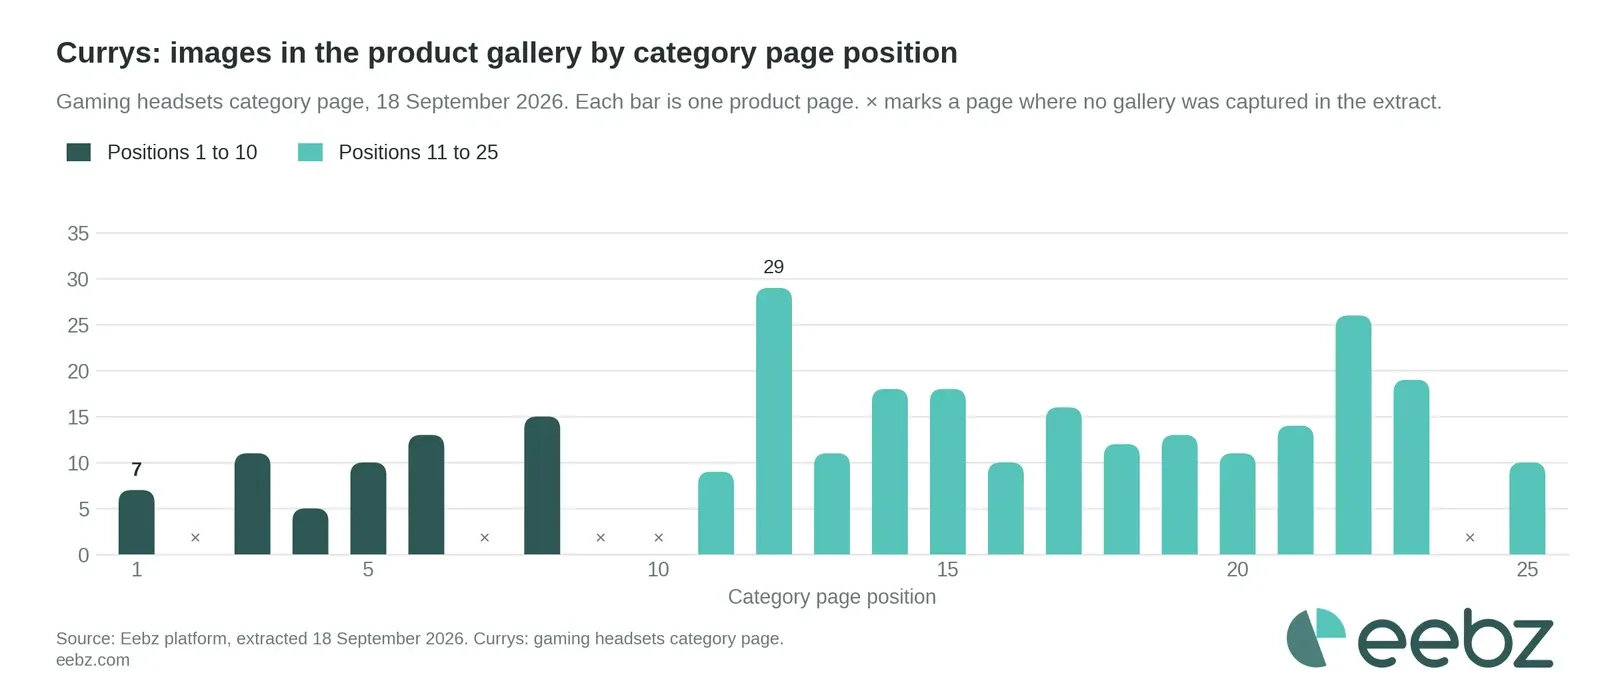
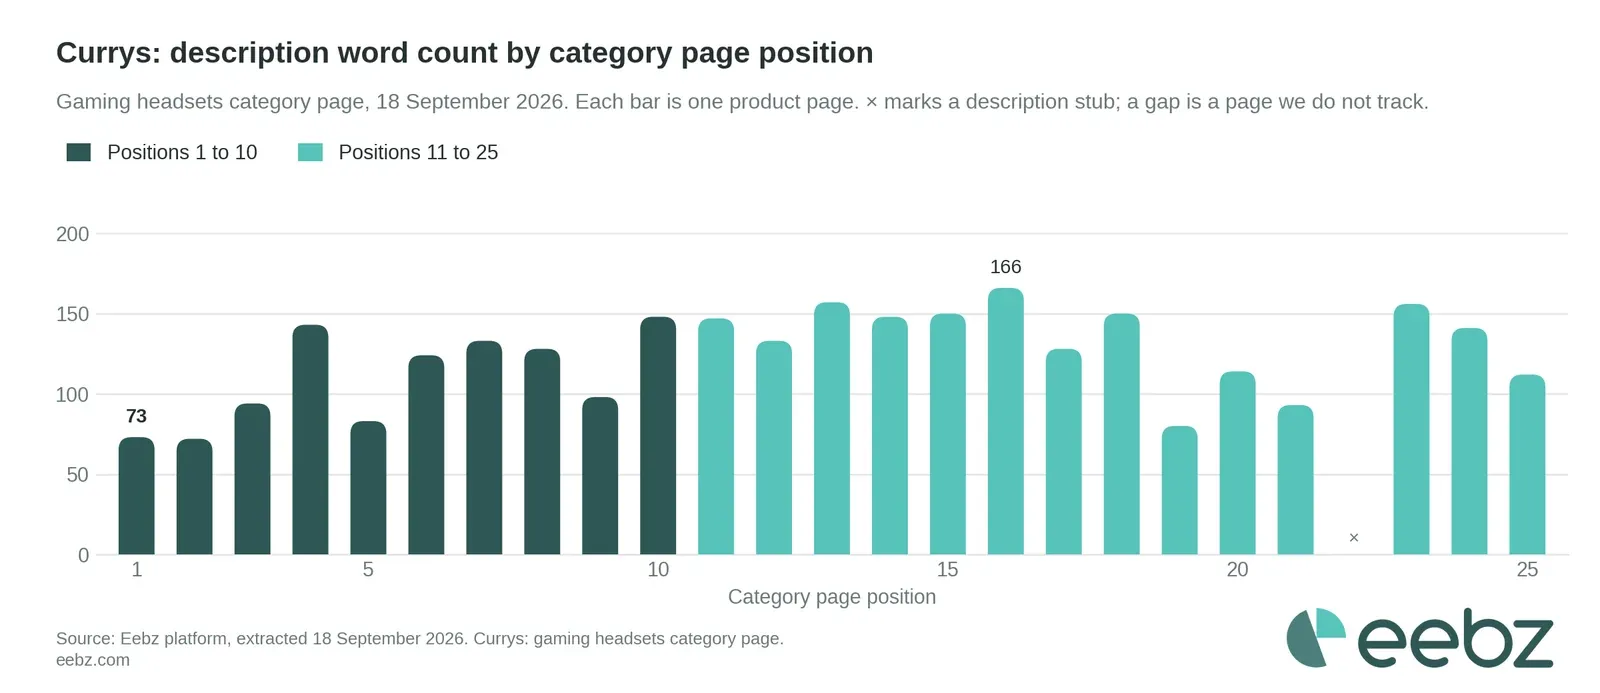
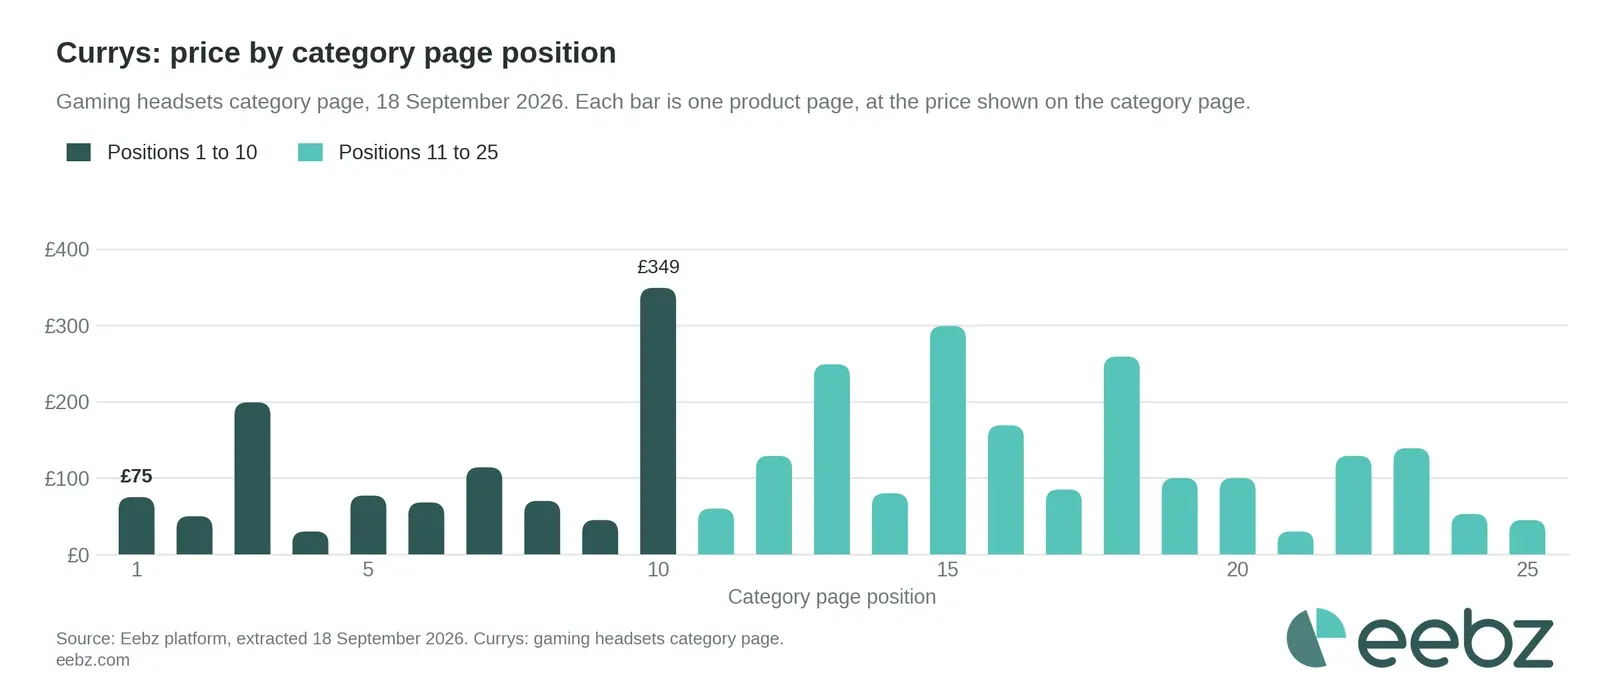
Talk of content audits usually starts with a count: how many images, how many words. So we counted. On 18 September we took the top 25 gaming headsets by category page position at Amazon UK, Argos and Currys and pulled the image count and description word count from every product page, straight from the Eebz platform. Then we pulled the price, review count, rating, availability and seller for the same 75 pages, to see what the top 10 do have in common.
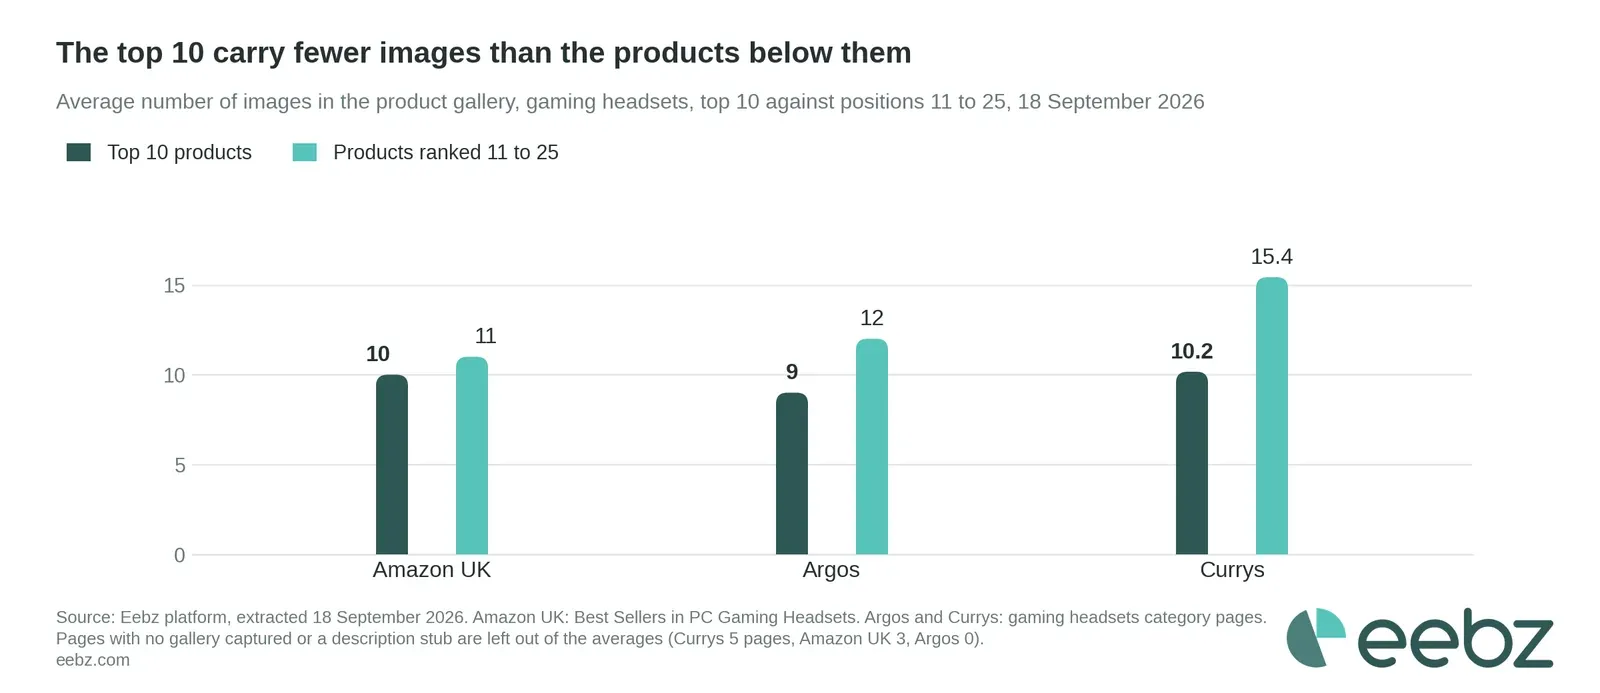
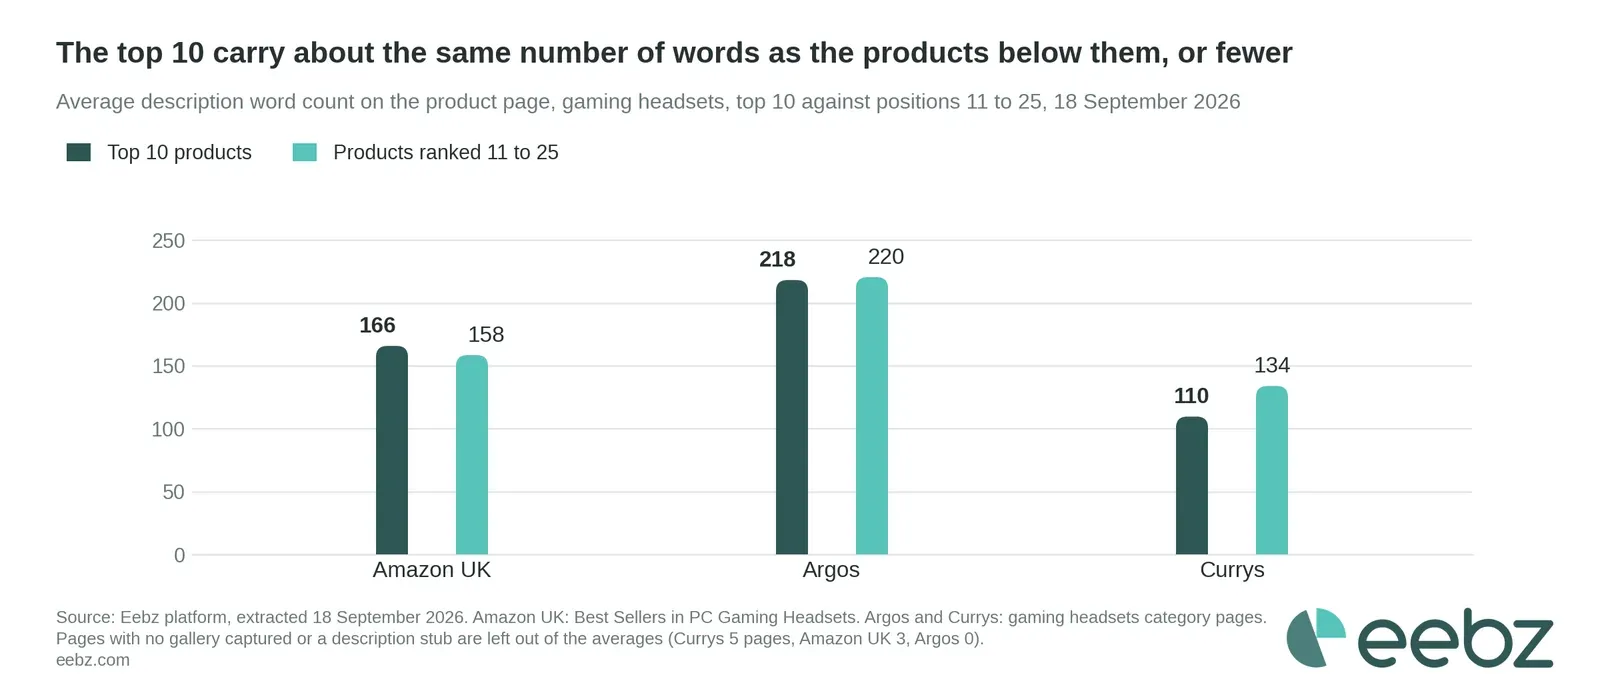
The pattern is the same at all three. The top 10 pages carry fewer images on average than the products ranked 11 to 25 (10 against 11 at Amazon UK, 9 against 12 at Argos, 10 against 15 at Currys) and about the same number of words (166 against 158, 218 against 220, 110 against 134). The two products at the top of the Argos page have four images each. The most content in the Argos top 10, 18 images and 267 words on the Turtle Beach Stealth 600 Gen 3, sits at number nine. At Amazon UK the page with the fewest words in the top 10 has the most images.
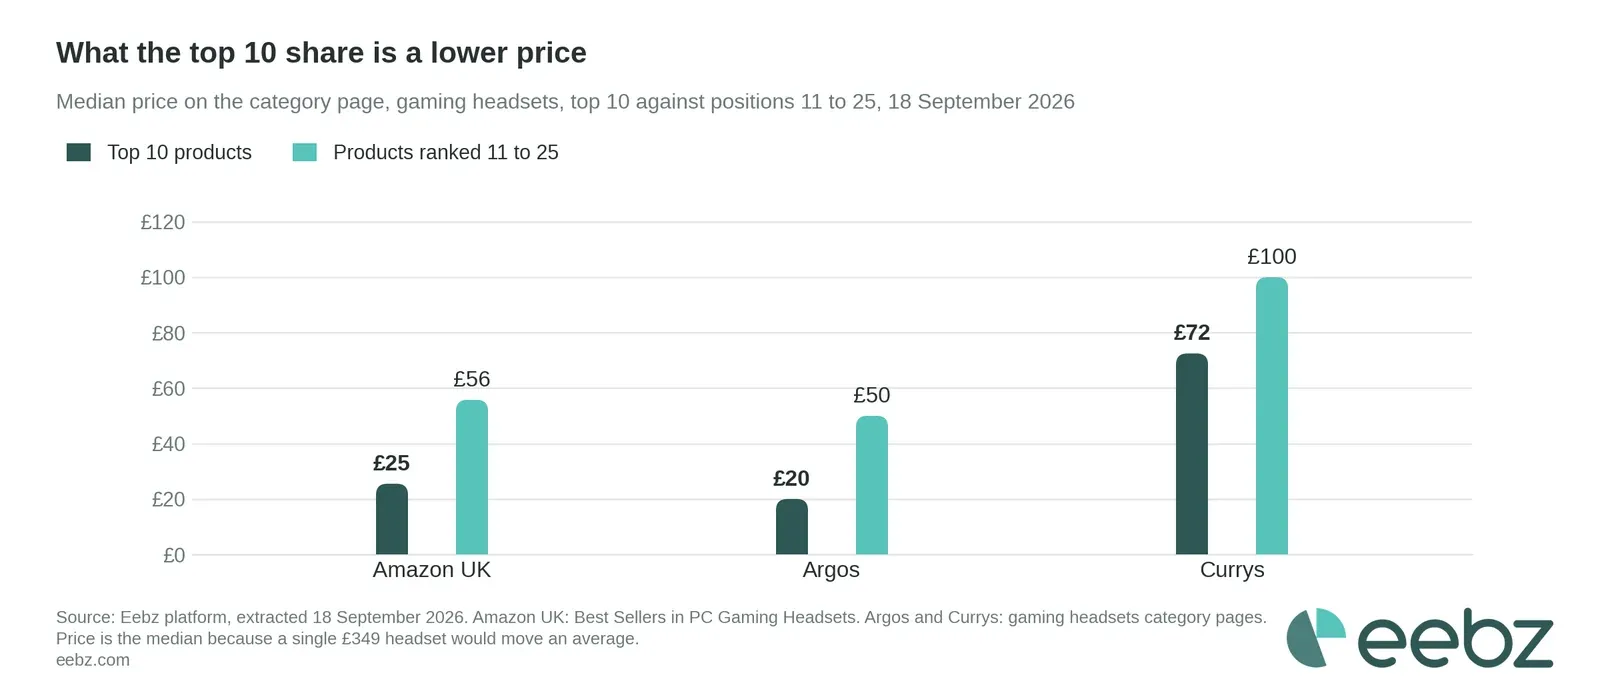
What the top 10 do share is price. The median top 10 headset costs £25 at Amazon UK and £20 at Argos, against £56 and £50 for positions 11 to 25; at Currys it is £72 against £100. Reviews count at Amazon UK, where the list is a sales rank: the median top 10 page carries about 2,800 reviews against 1,200 lower down. They do not explain Currys, where the retailer's own order puts three pages with one review between them at the top. Star ratings are level everywhere, within a tenth of a star. Every one of the 75 pages was in stock, and the Buy Box does not separate the groups at Amazon UK either: Amazon itself is the seller on four of the top 10 pages and on six of the 13 pages below that we track.
Content still has a job, and the evidence above says it is worth real money at the margin: it converts the shopper who has reached the page. What the numbers say is that image count and word count do not separate the top of a category from the middle of it, so an audit that leads with them is measuring the wrong thing first. Availability, discoverability, brand compliance and price come before content, and the section on prioritising by commercial impact below sets out the order.
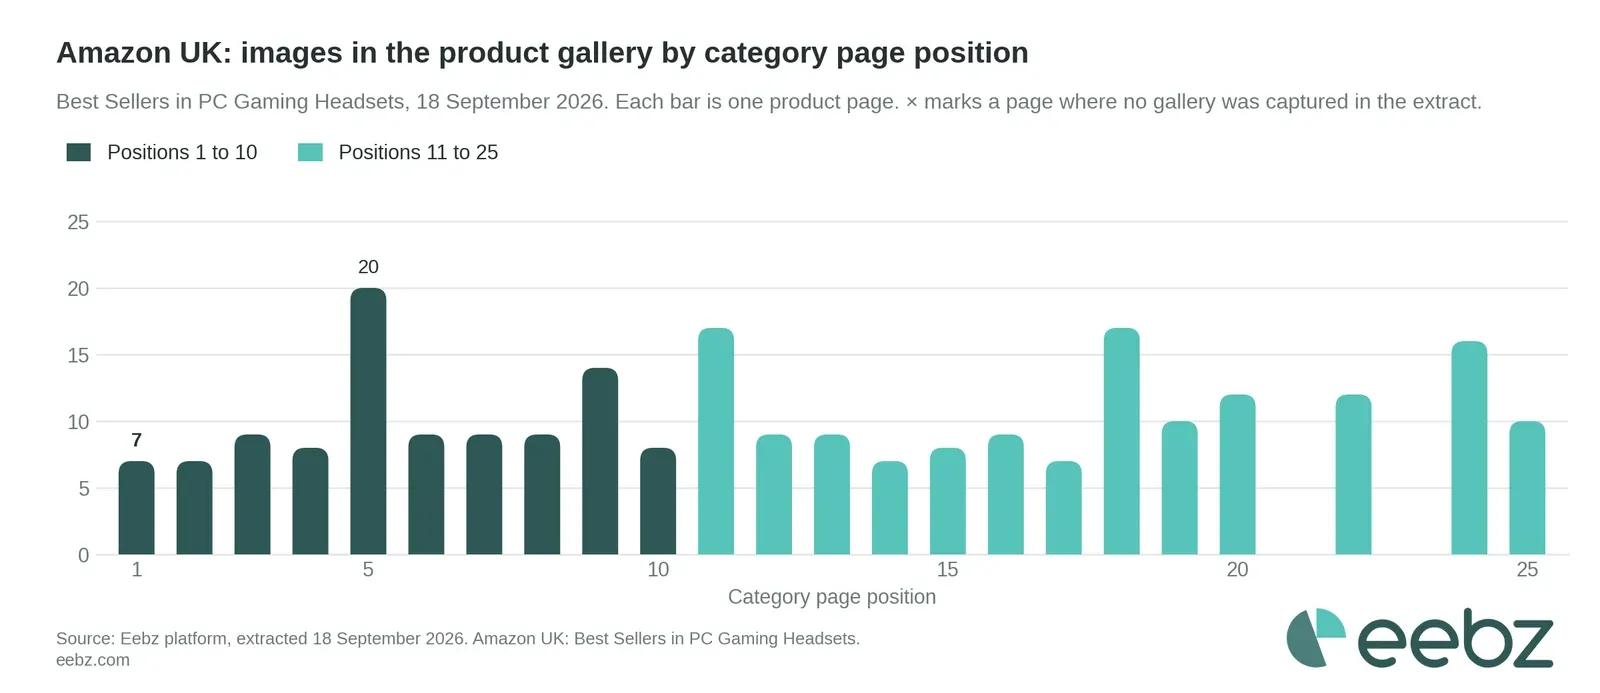
The tables below give every product, retailer by retailer. Positions 1 to 5 are open; the charts by position and positions 6 to 25 sit behind a click. Price is the price shown on the category page on 18 September. Reviews is the review count, taken from the Amazon UK list on 18 September and from the Argos and Currys product pages on 21 September, because those two category pages carry no review data. Words is the description word count on the product page. Images is the number of images in the product gallery. Rich content is whether the page carries a manufacturer content module. Not captured means the extract returned no gallery for that page, which is then left out of the image averages; stub means a description of ten words or fewer; not tracked means the product page is not yet in the extract. Four Argos pages show no reviews in our extract, and we have not confirmed those against the site.
Amazon UK, Best Sellers in PC Gaming Headsets
| Position | Brand | Product | Price | Reviews | Words | Images | Rich content |
|---|---|---|---|---|---|---|---|
| 1 | HyperX | Cloud III wired | £64.00 | 12,507 | 169 | 7 | yes |
| 2 | Ozeino | RGB stereo gaming headset | £17.99 | 26,504 | 217 | 7 | yes |
| 3 | Corsair | Void v2 Wireless | £69.99 | 2,182 | 136 | 9 | yes |
| 4 | Betron | Wired gaming headset | £13.99 | 840 | 210 | 8 | yes |
| 5 | SteelSeries | Arctis Nova 7 Wireless Gen 2 | £149.99 | 197 | 105 | 20 | yes |
Show the charts and positions 6 to 25 at Amazon UK
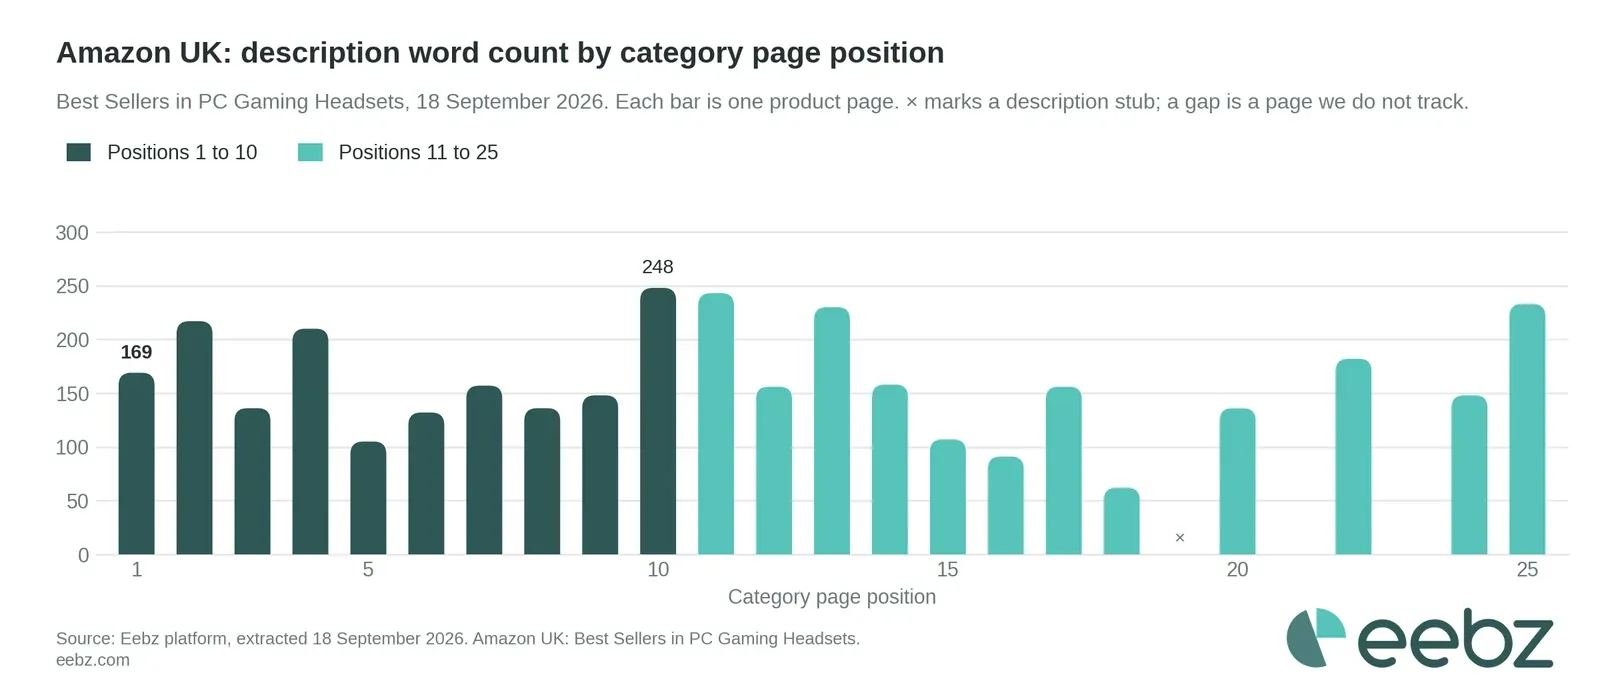
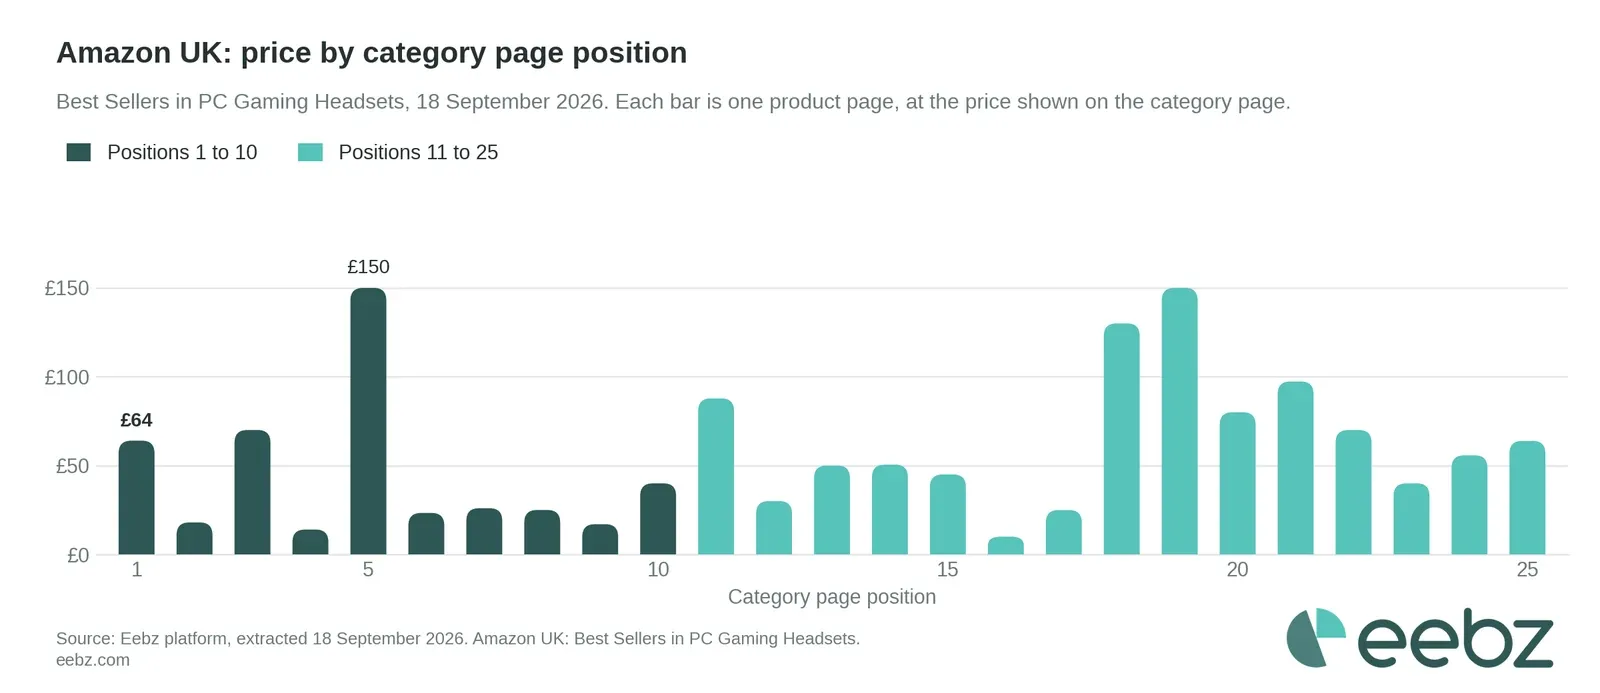
| Position | Brand | Product | Price | Reviews | Words | Images | Rich content |
|---|---|---|---|---|---|---|---|
| 6 | Turtle Beach | Recon 70 Camo White | £23.32 | 18,269 | 132 | 9 | yes |
| 7 | JBL | Quantum 100M2 | £25.99 | 6,588 | 157 | 9 | yes |
| 8 | Turtle Beach | Recon 70 White | £24.99 | 1,450 | 136 | 9 | yes |
| 9 | IMYB | A36 | £16.99 | 3,359 | 148 | 14 | yes |
| 10 | Razer | Kraken V3 X USB | £39.99 | 527 | 248 | 8 | yes |
| 11 | Razer | BlackShark V2 HyperSpeed | £87.77 | 1,196 | 243 | 17 | yes |
| 12 | EKSA | E900 Wired | £29.99 | 2,866 | 156 | 9 | yes |
| 13 | Sony | Inzone H3 | £50.00 | 937 | 230 | 9 | yes |
| 14 | Logitech | G432 Wired | £50.50 | 29,142 | 158 | 7 | yes |
| 15 | Turtle Beach | Atlas 200 Wired | £45.00 | 323 | 107 | 8 | yes |
| 16 | Stealth | C6-100 Range, Green | £9.99 | 2,415 | 91 | 9 | yes |
| 17 | JBL | Quantum 100 Wired | £24.95 | 24,576 | 156 | 7 | yes |
| 18 | HyperX | Cloud Alpha Wireless | £129.99 | 6,572 | 62 | 17 | yes |
| 19 | Logitech | G Pro X 2 Lightspeed | £149.99 | 2,033 | stub | 10 | yes |
| 20 | Turtle Beach | Stealth 600 Wireless | £79.99 | 1,178 | 136 | 12 | yes |
| 21 | Corsair | HS80 Max Wireless | £97.30 | 1,179 | not tracked | not tracked | |
| 22 | Razer | Barracuda X | £69.98 | 724 | 182 | 12 | yes |
| 23 | NUBWO | Wireless gaming headset | £39.99 | 23,013 | not tracked | not tracked | |
| 24 | SteelSeries | Arctis Nova 5 Wireless | £55.75 | 1,058 | 148 | 16 | yes |
| 25 | Razer | Kraken V4 X | £63.89 | 441 | 233 | 10 | yes |
Argos, gaming headsets category page
| Position | Brand | Product | Price | Reviews | Words | Images | Rich content |
|---|---|---|---|---|---|---|---|
| 1 | Gioteck | XH100P | £12.99 | 472 | 216 | 4 | no |
| 2 | Gioteck | XH100X | £12.99 | 472 | 203 | 4 | no |
| 3 | JBL | Quantum 100P | £24.99 | 216 | 223 | 8 | yes |
| 4 | JBL | Quantum 100 | £24.99 | 216 | 212 | 8 | yes |
| 5 | Turtle Beach | Recon 50X | £14.99 | 5,256 | 209 | 10 | no |
Show the charts and positions 6 to 25 at Argos
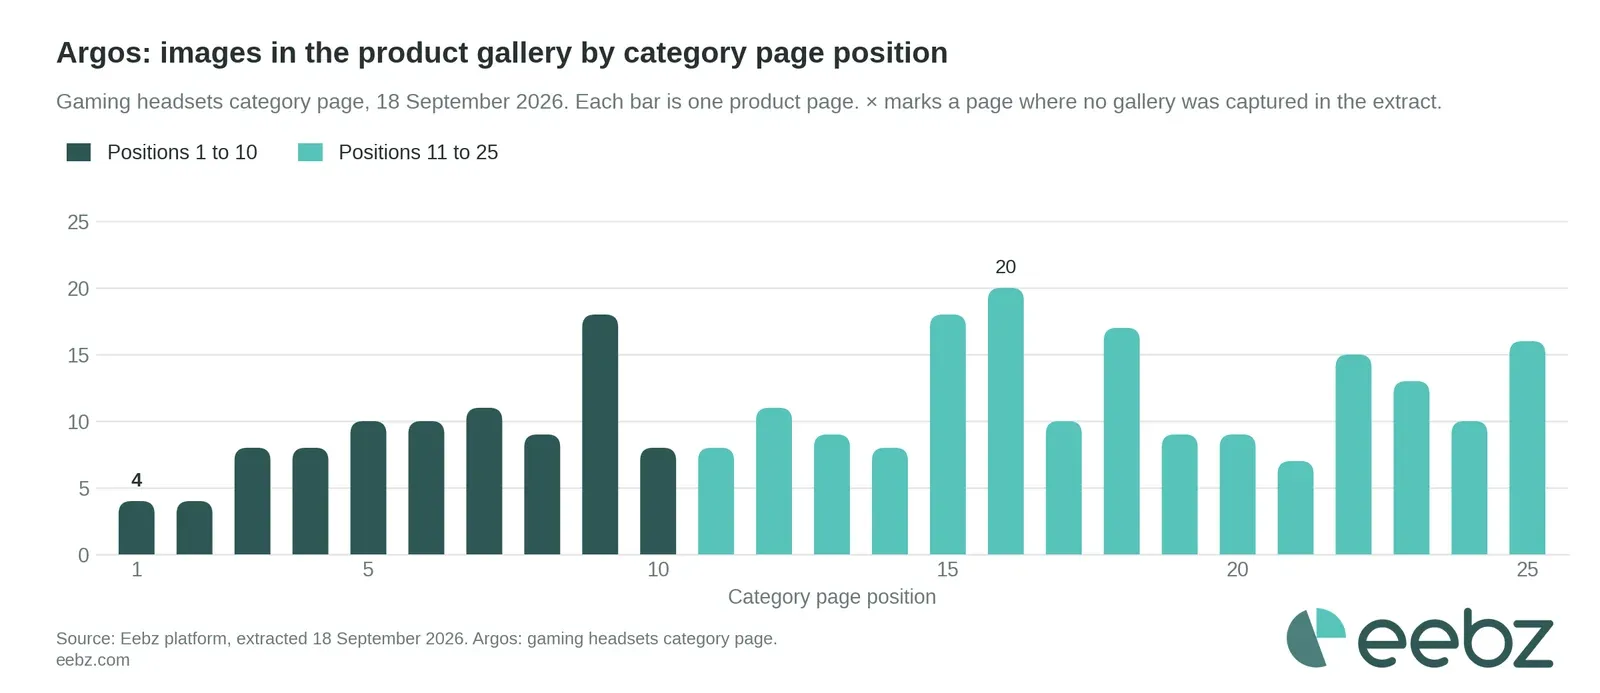
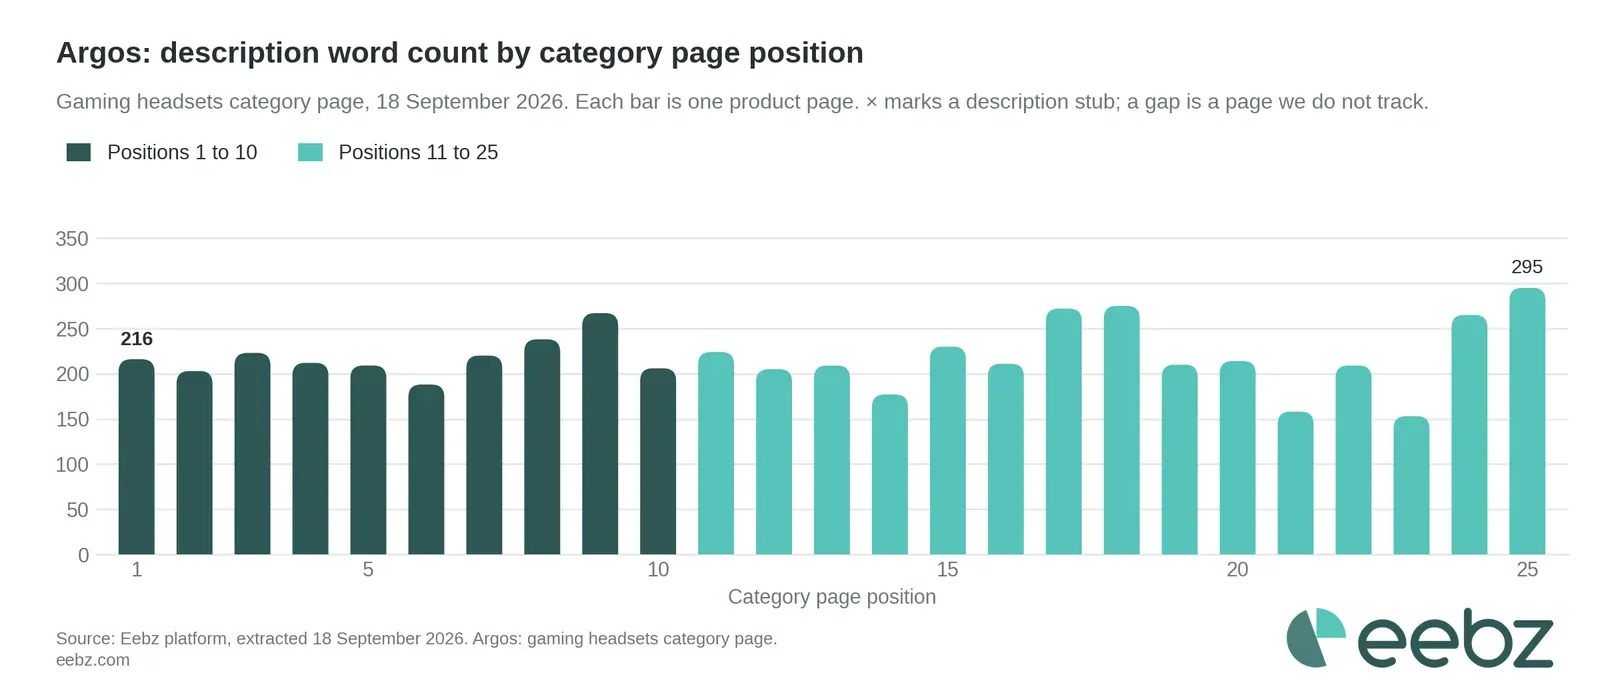
| Position | Brand | Product | Price | Reviews | Words | Images | Rich content |
|---|---|---|---|---|---|---|---|
| 6 | Turtle Beach | Recon 50P | £14.99 | 5,502 | 188 | 10 | no |
| 7 | Turtle Beach | Recon 70 | £29.99 | 0 | 220 | 11 | no |
| 8 | Stealth | C6-100 | £9.99 | 1,954 | 238 | 9 | no |
| 9 | Turtle Beach | Stealth 600 Gen 3 Wireless | £99.99 | 0 | 267 | 18 | yes |
| 10 | Turtle Beach | Recon 70 (second listing) | £29.99 | 0 | 206 | 8 | no |
| 11 | Maxx Tech | MX40 LED | £12.99 | 19 | 224 | 8 | no |
| 12 | PlayStation | Pulse Elite Wireless, White | £119.99 | 253 | 205 | 11 | no |
| 13 | Stealth | C6-100 Strike | £19.99 | 1,954 | 209 | 9 | no |
| 14 | Logitech | H151 Stereo PC Headset | £19.99 | 234 | 177 | 8 | yes |
| 15 | GXTrust | Pine Wired Gaming Earphones | £24.99 | 15 | 230 | 18 | no |
| 16 | HyperX | Cloud Jet Dual Wireless | £54.99 | 40 | 211 | 20 | yes |
| 17 | PlayStation | Pulse Elite Wireless, Midnight Black | £119.99 | 253 | 272 | 10 | no |
| 18 | Turtle Beach | Stealth 500 Wireless PS5 | £79.99 | 98 | 275 | 17 | yes |
| 19 | Logitech | G Pro X | £59.99 | 137 | 210 | 9 | no |
| 20 | Turtle Beach | Recon 70 Arctic | £29.99 | 0 | 214 | 9 | yes |
| 21 | Deltaco | DH120 Wired | £14.99 | 4 | 158 | 7 | no |
| 22 | SteelSeries | Arctis Nova 1 | £49.99 | 282 | 209 | 15 | no |
| 23 | Turtle Beach | Atlas 200 | £49.99 | 37 | 153 | 13 | yes |
| 24 | SteelSeries | Arctis Nova Pro Omni Wireless | £349.99 | 2 | 265 | 10 | yes |
| 25 | Turtle Beach | Stealth 500 Wireless Xbox | £79.99 | 191 | 295 | 16 | yes |
Currys, gaming headsets category page
| Position | Brand | Product | Price | Reviews | Words | Images | Rich content |
|---|---|---|---|---|---|---|---|
| 1 | Glorious | GHS Eternal RGB | £74.99 | 0 | 73 | 7 | yes |
| 2 | Glorious | GHS Eternal Wired | £49.99 | 1 | 72 | not captured | yes |
| 3 | Glorious | GHS InfinitePlay Wireless | £199.00 | 0 | 94 | 11 | yes |
| 4 | Razer | Kraken X Lite 7.1 | £29.99 | 318 | 143 | 5 | yes |
| 5 | SteelSeries | Arctis Nova 3X Wireless | £76.99 | 24 | 83 | 10 | yes |
Show the charts and positions 6 to 25 at Currys
| Position | Brand | Product | Price | Reviews | Words | Images | Rich content |
|---|---|---|---|---|---|---|---|
| 6 | HyperX | Cloud II Pro 7.1 | £67.97 | 298 | 124 | 13 | yes |
| 7 | HyperX | Cloud III S Wireless | £114.00 | 246 | 133 | not captured | yes |
| 8 | HyperX | Cloud III wired | £69.99 | 246 | 128 | 15 | yes |
| 9 | HyperX | Cloud Jet Wireless | £44.99 | 36 | 98 | not captured | yes |
| 10 | SteelSeries | Arctis Nova Pro Omni Wireless | £349.00 | 0 | 148 | not captured | yes |
| 11 | Razer | BlackShark V2 X | £59.99 | 261 | 147 | 9 | yes |
| 12 | SteelSeries | Arctis Nova 5 Wireless | £129.00 | 212 | 133 | 29 | yes |
| 13 | Razer | BlackShark V3 Pro Wireless | £249.00 | 2 | 157 | 11 | yes |
| 14 | Turtle Beach | Stealth 500 PlayStation Wireless | £79.99 | 4 | 148 | 18 | yes |
| 15 | Turtle Beach | Stealth Pro II Wireless | £299.00 | 0 | 150 | 18 | yes |
| 16 | SteelSeries | Arctis Nova 7X Gen 2 | £169.00 | 1 | 166 | 10 | yes |
| 17 | HyperX | Cloud III wired, Black | £84.99 | 246 | 128 | 16 | yes |
| 18 | Logitech | G Astro A50 Lightspeed | £259.00 | 161 | 150 | 12 | yes |
| 19 | Logitech | G Pro X 7.1 | £99.99 | 222 | 80 | 13 | yes |
| 20 | Corsair | Void Wireless v2 | £99.99 | 2 | 114 | 11 | yes |
| 21 | HyperX | Cloud Stinger 2 Core | £29.99 | 510 | 93 | 14 | yes |
| 22 | SteelSeries | Arctis Nova 5P Wireless | £129.00 | 212 | stub | 26 | yes |
| 23 | Turtle Beach | Stealth 700 Gen 3 Wireless | £139.00 | 3 | 156 | 19 | yes |
| 24 | SteelSeries | Arctis Nova 1 | £52.99 | 58 | 141 | not captured | yes |
| 25 | Razer | BlackShark V2 X 7.1 for PlayStation | £44.99 | 261 | 112 | 10 | yes |
Source: Eebz platform, extracted 18 September 2026 (Argos and Currys review counts 21 September). Amazon UK: Best Sellers in PC Gaming Headsets. Argos and Currys: gaming headsets category pages. Position is the retailer's own order on the day.
What Amazon expects from a product page
Amazon publishes page standards, enforces them unevenly, and since January 2025 has reserved the right to rewrite non-compliant titles itself. The essentials:
- Titles: maximum 200 characters in most categories, though Amazon recommends around 80 so mobile shoppers see the whole thing. No promotional phrases, no all caps, no special characters like ! or ? unless they are part of the brand name, and no word repeated more than twice.
- Main image: pure white background (RGB 255,255,255), the product filling at least 85% of the frame, no text, logos or watermarks. Minimum 1,000 pixels on the longest side to enable zoom; 1,600 or more is better.
- Image count: up to nine images per listing, of which around seven display by default. Look at the top of any category and you will find six or more, plus video.
- Bullets: five, benefit-led, specific. This is the most-read text on the page, so it deserves better than a keyword dump.
- A+ content: available to brand-registered sellers, and given the numbers above, leaving it empty is a choice to sell less.
Every other retailer has its own version of these rules, usually less documented and less enforced. That gap between the written standard and what is actually live on the page is exactly what an audit measures.
Auditing for AI shopping assistants
The opening of this article mentioned AI shopping experiences, and then moved on. Time to come back to it.
AI assistants are already reading product pages to answer shopping questions, and they reward the same things an audit measures: complete specifications, accurate attributes, consistent naming across retailers, substantiated claims. A listing that is thin or inconsistent is not only losing shoppers - it is failing to be quotable. If an assistant cannot extract a clear, specific answer from your page, it will extract one from a competitor's.
This is not a forecast. Search Console already shows an AI-generated query reaching this site: which audit or inspection methodologies could realistically detect intraday price-change violations on digital shelf labels without real-time monitoring infrastructure. One impression, position 19. That is an assistant asking a serious methodology question and considering this article as a source.
The honest point is simple. Nobody knows how any specific assistant ranks or weights sources, and traffic projections would be invented. What we do know is that being specific and methodological is what makes a page citable, whether the reader is a person or a model. An audit that produces structured, substantiated, field-level findings is already formatted for both.
The KPIs worth putting on a scorecard
Audit findings only stick if they become numbers someone owns. A practical scorecard covers: in-stock rate, assortment coverage, content completeness and accuracy, image and rich media compliance, organic share of search, top-10 keyword ranking rate, average rating and review volume, price index against key competitors, Buy Box win rate, unauthorised seller incidence, delivery promise, and conversion where the retailer shares it.
Twelve numbers, one page, tracked over time. Resist the temptation to add forty more.
How often to audit each field
The right cadence follows volatility multiplied by the cost of being wrong, not by what is convenient to collect. Some fields move hourly and cost money the same day. Others change twice a year but are wrong on every day in between. Budget crawl time accordingly.
- Daily. Price, stock and availability, Buy Box seller, PLP and search rank, promotional tags and retail media placement, buyable flag, price-hidden. These move without warning, cost money the same day, and cannot be reconstructed later. A day not crawled is a day lost permanently
- Weekly. Review count and score, rank trend rather than rank position, new product detection, share of shelf
- Monthly or on change. Description quality, image count, video presence, A+ and enhanced content, product title, brand attribution, category placement and taxonomy mismatch, GTIN accuracy
- Quarterly. Ranging review, taxonomy structure, retailer coverage
Content fields are the ones teams get wrong. They are low volatility but high cumulative cost. An image count that drops changes maybe twice a year, but it is wrong on every single day in between. The value is in detecting the change event, not re-measuring the same number nightly. That is the opposite of how most teams budget crawl spend.
A one-off audit is a useful shock. It is also out of date the week you present it. Stock, price, search rank and Buy Box ownership move daily, so the high-impact variables need continuous monitoring, not an annual ritual. This is the argument for doing it with live data rather than an intern and a browser: by the time a quarterly audit reaches the trading meeting, the shelf it describes no longer exists.
How to run one
Define the scope along four dimensions before you touch a spreadsheet:
- Products: priority SKUs, variants, new launches and bestsellers
- Channels: marketplaces, retailers, quick-commerce platforms and your own site
- Markets: countries, regions and devices
- Competitors: direct alternatives and the category leaders
Then take a dated snapshot and compare every SKU and retailer combination against an agreed standard, for example our own PerfectPage scoring, where you select the set of parameters that matters to your organisation from more than 70, and weight them yourself.
Prioritise by commercial impact
The final output should not be a list of 4,000 errors. Rank findings by what they cost:
- Out of stock: nothing else matters if shoppers can't buy it
- Can't be found: does the product index for every search term that matters, is it flagged as new, where does it rank? Available but invisible is a quieter version of the same problem. Retail media fixes much of it, and in our data it earns most on products sitting lower down the category; a product already at number one does not need it
- Off brand at the retailer: shoppers move between retailer sites and see your product page far more often than your own, so the wrong name, image or claim at one retailer costs impressions long before it costs a sale
- Price out of line: MAP breaches, unauthorised discounting and promotions that start late or never appear, the damage that shows up the same week
- Weak or inaccurate content: found but not converting, and the data above says this is worth real money, at the margin
- Consistency and polish: worth fixing, after the first five
Fix in that order and the audit pays for itself before you reach item five.
If you'd rather see this done to your own products than read about it, we'll run a free digital shelf audit for you: your key SKUs, your retailers, scored and prioritised, back within five working days.